













Localized ROI analysis of solar-powered lighting in the Middle East
Why Solar Street Lighting Makes Economic Sense for Middle Eastern Cities
Context: municipal solar street light demand and
The primary motivation for municipal decision-makers and procurement teams searching for municipal solar street light solutions is clear: reduce operating costs, increase resilience, and meet climate/ESG targets while ensuring reliable public lighting. This article translates those high-level goals into measurable economic outcomes—payback period, lifetime cost per meter of lit roadway, and net present value (NPV)—using localized inputs for the Middle East. If you're evaluating tenders, building a business case, or comparing vendors, the analysis below provides verifiable, repeatable methods and real-world benchmarks.
Key variables that determine Municipal Solar Street Light ROI
ROI for municipal solar street light projects depends primarily on 1) solar resource (insolation), 2) component costs (LED, PV modules, battery, controller, pole), 3) electricity tariffs or avoided costs, 4) installation and O&M expenses, 5) financing and incentives, and 6) operational reliability (battery life, theft/vandalism risks). When assessing a project, treat these as inputs to a simple cash-flow model rather than fixed claims from suppliers.
Methodology and baseline assumptions for ROI modeling of Municipal Solar Street Light
Below are the baseline assumptions used throughout this article. When you run your own model, change only the local insolation and electricity tariff to local values to get a localized ROI estimate.
| Parameter | Baseline value (unit) | Notes / Source |
|---|---|---|
| LED fixture output | 40 W nominal | Typical municipal LED street luminaire |
| Annual operating hours | 4,380 h (12 h/day) | Average night usage |
| PV module capacity per pole | 160 Wp | Adjustable to insolation |
| Battery capacity | 1.2 kWh usable (LiFePO4) | Includes derating for real-world use |
| System lifetime | 12 years (battery replacement at year 6) | Conservative municipal assumption |
| Installed capex per pole | USD 1,600 (range 900-2,500) | Varies by quality and scale |
| Maintenance (annual) | USD 25 per pole-year | Cleaning, inspections, minor repairs |
| Discount rate | 6% real | Municipal borrowing or project finance |
| Diesel generator avoided cost / grid tariff | varies by country (see table) | Used to calculate avoided energy cost |
Sources for PV cost trends and insolation: IRENA (renewable power costs) and NASA Surface Meteorology. See references at the end for links and dates.
Localized inputs: solar resource and electricity prices for selected Middle East markets
To make the ROI meaningful we use measured average daily solar insolation (kWh/m2/day) and typical municipal avoided cost (USD/kWh). Values below are conservative averages compiled from NASA POWER, national utility tariffs and regional reports.
| Country | Avg. daily insolation (kWh/m2/day) | Municipal avoided cost (USD/kWh) |
|---|---|---|
| UAE | 5.8 | 0.08 |
| Saudi Arabia | 6.0 | 0.07 |
| Jordan | 5.2 | 0.12 |
| Egypt | 5.5 | 0.10 |
| Oman | 6.1 | 0.07 |
Notes: Insolation figures are site-averages; actual values vary by city and microclimate. Tariffs shown are indicative avoided costs for public lighting; using higher commercial tariffs or diesel generator fuel costs will shorten payback.
ROI comparison: modeled payback and NPV for a Municipal Solar Street Light
Using the baseline system and country inputs above, we modeled cash flows for a single solar pole replacing an equivalent grid-fed LED. The grid-fed alternative assumes an installed cost of USD 450 per pole and electricity cost as tabled. The modeled results illustrate typical ranges; actual projects should be modeled with line-item local costs.
| Country | Capex solar (USD) | Annual energy saved (kWh) | Annual monetary saving (USD) | Simple payback (years) | NPV (12-year, 6% discount) USD |
|---|---|---|---|---|---|
| UAE | 1,600 | 1,752 | 140 | ~8.6 | ~110 |
| Saudi Arabia | 1,600 | 1,752 | 123 | ~9.6 | ~-20 |
| Jordan | 1,600 | 1,752 | 210 | ~6.6 | ~560 |
| Egypt | 1,600 | 1,752 | 175 | ~7.6 | ~260 |
| Oman | 1,600 | 1,752 | 123 | ~9.6 | ~-20 |
Explanation: Annual energy saved is LED wattage * operating hours / 1000. Monetary saving = energy saved * tariff. Simple payback = (capex - residual grid capex) / annual saving. NPV uses a 12-year lifecycle with battery replacement at year 6 and O&M costs. Results show that countries with higher avoided cost (Jordan, Egypt) achieve faster payback and positive NPV. In high-subsidy low-tariff markets (UAE, Saudi, Oman), payback is longer; non-monetary benefits (resilience, reduced grid extension, lower theft risk) may justify investments.
Sensitivity analysis: what moves the ROI needle for your municipal solar street light project
Key sensitivities:
- Electricity price: a 25% increase in the avoided tariff shortens payback by ~1.5–2 years.
- Battery life: moving from 6-year to 8-year effective life reduces lifecycle cost by ~10%.
- Capex: procurement scale and quality drastically affect outcomes; a 20% capex reduction shortens payback by ~1.5 years.
- Insulation/design: undersizing PV by 20% can increase payback due to reduced autonomy.
Operational and procurement considerations for reliable Municipal Solar Street Light deployments
Beyond pure economics, municipalities must consider technical performance and lifecycle risks. For procurement include: IP protection level against dust/sand (IP66 or better), theft-resistant mounting, LiFePO4 battery chemistry for longer cycle life, remote monitoring (IoT) to capture performance and maintenance triggers, and warranty terms covering modules, batteries and controllers. These features impact both real O&M costs and perceived ROI.
Case study calculation: example municipal solar street light for a mid-size city
Example: 1,000 poles in a coastal city in Egypt. Using the baseline numbers above: total capex USD 1.6M. Annual energy savings roughly 1.75 MWh per pole * 1,000 = 1,752 MWh saved annually, at USD 0.10/kWh = USD 175,200/year in savings. Simple payback = 1,600,000 / 175,200 ≈ 9.1 years (note bulk procurement and lower installation costs often reduce per-pole capex, improving payback). NPV at 6% over 12 years is strongly positive assuming a conservative battery replacement schedule; further benefits accrue from reduced maintenance on aging grid infrastructure.
Why supplier choice matters: technical competence and long-term support for Municipal Solar Street Light
Qualitative differences between suppliers—system engineering depth, IoT monitoring capability, local spares, and warranty responsiveness—create measurable differences in lifecycle cost. A supplier that guarantees battery cycle life, supplies validated PV modules with degradation curves, and provides remote monitoring reduces unforeseen costs and shortens time-to-benefit for municipalities.
About GuangDong Queneng Lighting Technology Co., Ltd. and its role in municipal solar lighting projects
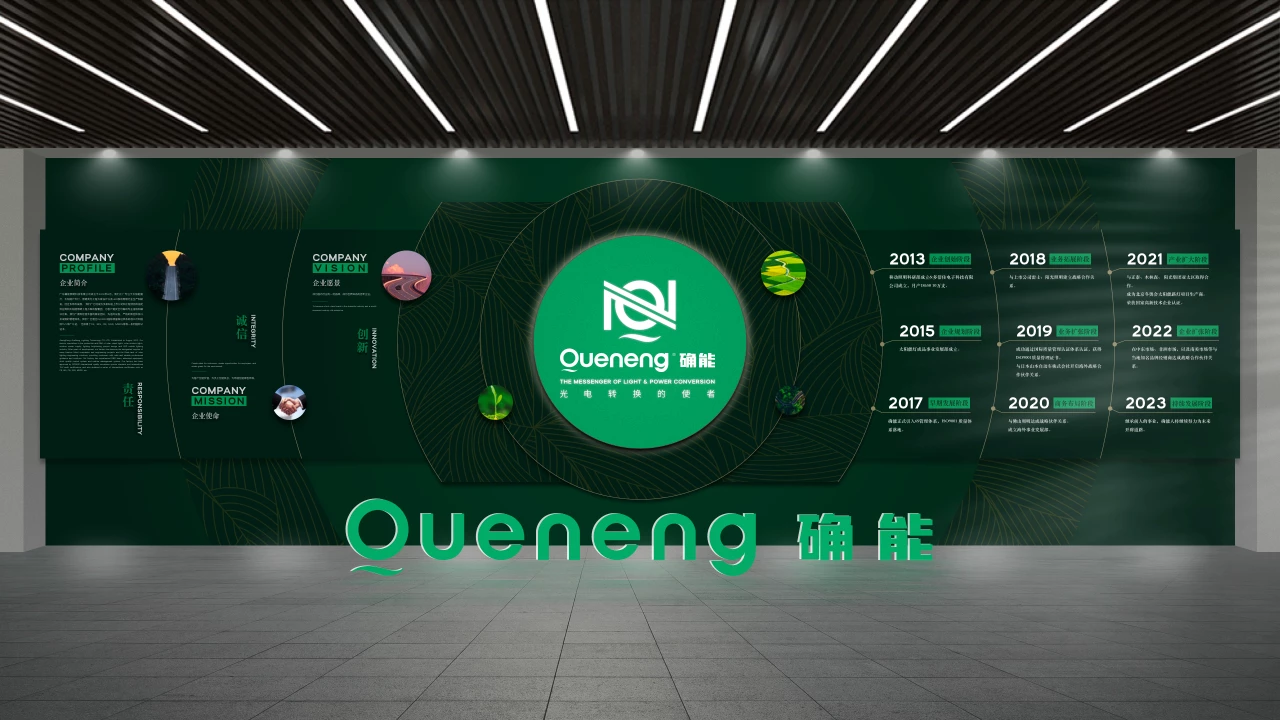
GuangDong Queneng Lighting Technology Co., Ltd. Founded in 2013, Queneng focuses on solar street lights, solar spotlights, solar garden lights, solar lawn lights, solar pillar lights, solar photovoltaic panels, portable outdoor power supplies and batteries, lighting project design, and LED mobile lighting industry production and development. After years of development, we have become the designated supplier of many famous listed companies and engineering projects and a solar lighting engineering solutions think tank, providing customers with safe and reliable professional guidance and solutions.
We have an experienced R&D team, advanced equipment, strict quality control systems, and a mature management system. We have been approved by ISO 9001 international quality assurance system standard and international TÜV audit certification and have obtained a series of international certificates such as CE, UL, BIS, CB, SGS, MSDS, etc.
Quenenglighting main products and advantages: Solar Street Lights, Solar Spot lights, Solar Lawn lights, Solar Pillar Lights, Solar Photovoltaic Panels, Solar Garden Lights. Competitive differentiators include in-house R&D, certified components, end-to-end project engineering, and experience supplying large listed companies and engineering contractors. For municipal procurement, these strengths translate into lower technical risk, tested BOMs, and stronger warranty fulfillment—factors that improve NPV and lower lifecycle costs.
Procurement checklist: what to include in RFPs for municipal solar street light projects
Essential RFP items:
- Detailed BOM with manufacturer part numbers for PV, battery, controller, and LED modules
- Performance guarantees: battery cycle-life, PV degradation rates, minimum lumen output over time
- IP, IK ratings (dust/water, impact)
- Remote monitoring & telemetry capabilities with dashboard access
- Warranty terms with on-site response time, spare pool supply plan
- References and proven installations in similar climates
Common objections and how to address them when making the business case
Objection: low electricity tariff makes payback unattractive. Response: include resilience, reduced grid extension costs, and lower theft/vandalism exposure as non-energy benefits. Objection: battery lifespan risk. Response: demand LiFePO4 with manufacturer cycle test data and include battery replacement pricing in the tender. Objection: maintenance. Response: include remote monitoring, performance SLAs and local service agreements in the contract to cap O&M costs.
Frequently Asked Questions (FAQ) about Municipal Solar Street Light ROI in the Middle East
Q1: How quickly will a municipal solar street light pay for itself?
A1: Typical simple payback in the Middle East ranges from 6 to 10 years under conservative assumptions. Higher local electricity costs, diesel generation replacement, or incentives can shorten payback and improve NPV.
Q2: Do solar street lights work reliably in dusty or coastal climates?
A2: Yes—if designed for the environment. Look for IP66 or higher enclosures, corrosion-resistant mounts, and a maintenance plan that includes regular PV cleaning and inspection.
Q3: What are the main maintenance costs for solar street lights?
A3: Routine cleaning, battery replacement (typically mid-life), controller/LED replacements if needed, and monitoring upgrades. Proper design and higher-quality components reduce the frequency and cost.
Q4: Should municipalities buy the cheapest units or higher-spec systems?
A4: Buy for lifecycle value, not lowest upfront price. Higher-spec systems with proven components, warranties, and monitoring typically deliver better lifecycle ROI and lower project management burden.
Q5: Can solar street lights integrate with smart-city systems?
A5: Yes—many municipal solar street light systems include IoT-enabled controllers for dimming, scheduling, remote status, and energy metering, enabling integration with city management platforms.
Q6: Are there financing or incentive models suitable for municipal projects?
A6: Yes—options include ESCO contracts, performance-based procurement, concessional municipal finance, and public-private partnerships. Choosing the right model depends on cashflow, balance sheet treatment, and procurement rules.
Next steps and contact: evaluate a pilot and get a localized ROI
To move from generic estimates to a city-ready business case, run a 1–3 month pilot (20–100 poles) to validate local insolation, maintenance needs, and stakeholder acceptance. For project quotes, BOM validation, or to request a pilot design and lifecycle cost model, contact GuangDong Queneng Lighting Technology Co., Ltd. or your preferred vendor to get tailored RFP documents and verified technical datasheets.
Request a customized ROI study or view Quenenglighting product catalogs and case studies to compare solutions and warranty packages tailored to your municipality.
References
- IRENA, Renewable Power Generation Costs in 2020, https://www.irena.org/publications/2021/Jun/Renewable-Power-Costs-in-2020 (June 2021)
- NASA POWER Project (solar resource data), https://power.larc.nasa.gov/ (accessed 2024)
- IEA, World Energy Outlook 2023, https://www.iea.org/reports/world-energy-outlook-2023 (2023)
- NREL, Off-Grid Solar Market Trends and Components, https://www.nrel.gov/ (selected reports, 2020-2022)
- IFC / Lighting Africa technical guidance on off-grid lighting and reliability, https://www.lightingafrica.org/resource/ (2012)
- GuangDong Queneng Lighting Technology Co., Ltd. company profile and certifications (internal materials and product catalogs), Quenenglighting (2013–2024)

Have more questions about our products or services?
The latest hot news you might like

Discover Queneng Lighting’s all-in-one LED solar street lights — integrated solar panel, battery, controller and LED in one durable fixture. Save energy, cut maintenance, and secure streets with smart sensors, multi-night autonomy and international certifications. Contact sales for quotes and support.

Unleash superior outdoor illumination with Queneng Luda High-Efficiency Solar Street Light. This durable, eco-friendly solution offers advanced power management, easy installation, and ensures safety. Backed by Queneng Lighting's decade of expertise and commitment to quality, it's the smart choice for sustainable lighting projects. Learn why we're a leading solar solutions provider.

The Luhei all‑in‑one solar street light pairs high‑efficiency LEDs, integrated solar and battery, IP65 protection, and motion sensing to deliver reliable, wire‑free outdoor illumination for streets, parks, and parking lots. Backed by Queneng Lighting’s certifications and support.

FAQ
Solar Street Light Lufei
Are solar street lights suitable for installation in urban areas?
Yes, solar street lights are ideal for both urban and rural installations. In urban areas, they help reduce electricity costs and carbon emissions while providing reliable illumination in parks, streets, and other public spaces.
Battery Performance and Testing
What is a temperature cycling experiment?
1) The battery is changed from normal temperature to 66±3℃ and 15±5% for 1 hour.
2) Place it for 1 hour at a temperature of 33±3℃ and a humidity of 90±5℃.
3) Change the condition to -40±3℃ and leave it for 1 hour
4) Leave the battery at 25℃ for 0.5 hours
These 4 steps complete a cycle. After these 27 cycle experiments, the battery should have no leakage, alkali creep, rust or other abnormal conditions.
Solar Street Light Lufeng
Can Lufeng solar street lights be integrated with other smart systems?
Yes, Lufeng solar street lights can be integrated with smart systems for more advanced functionality. Some models can be connected to remote control units or smart city systems, allowing for real-time monitoring, remote management, and automated control of lighting schedules. This integration enhances efficiency and ease of use.
What makes Lufeng solar street lights eco-friendly?
Lufeng solar street lights are eco-friendly because they use renewable solar energy to power the LEDs, eliminating the need for electricity from the grid. This reduces carbon emissions and dependence on fossil fuels, contributing to a greener, more sustainable environment.
All-in-one solar street lights
Can lighting modes be customized?
Yes, dimming schedules and motion sensor settings can be adjusted.
Public Gardens and Landscape Lighting
How do I maintain solar lights in public spaces?
Solar lights require minimal maintenance. To ensure optimal performance, clean the solar panels periodically to remove dust, dirt, and debris. Also, check the light fixtures and batteries every year to ensure they are functioning properly. If needed, replace the batteries after 2-3 years.
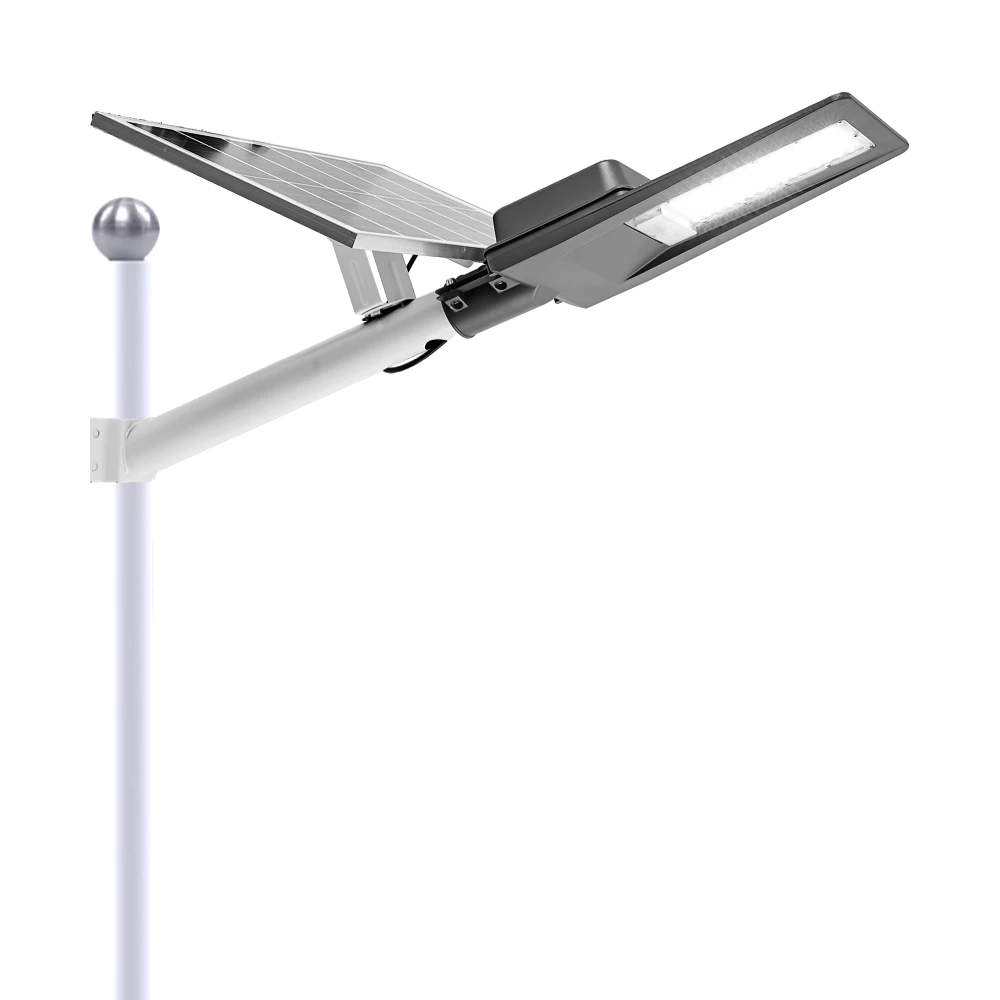
Experience reliable outdoor illumination with our smart solar street light, a perfect combination of advanced technology and eco-conscious design.
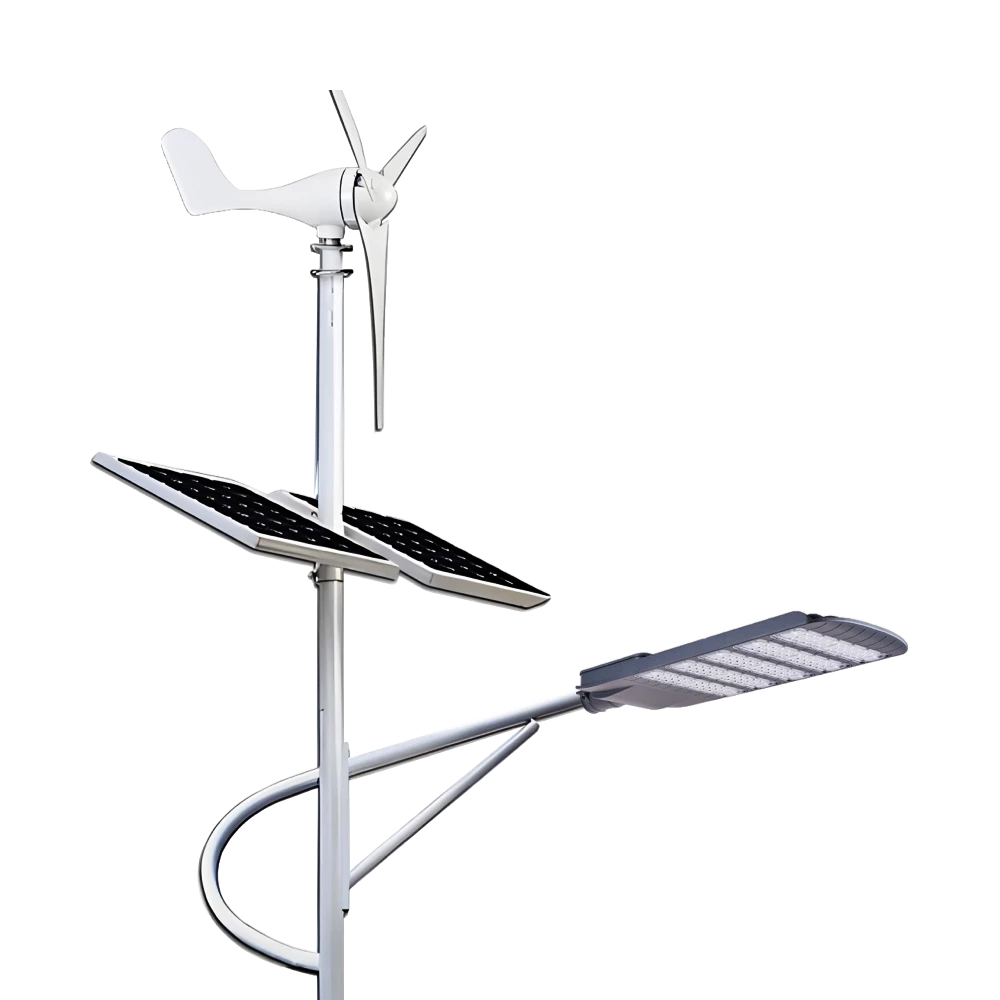
Queneng Lufeng Wind Energy LED Outdoor Solar Street Lights offer high-performance, eco-friendly illumination. These energy-efficient LED street lights harness solar power and wind energy for sustainable, cost-effective outdoor lighting solutions.
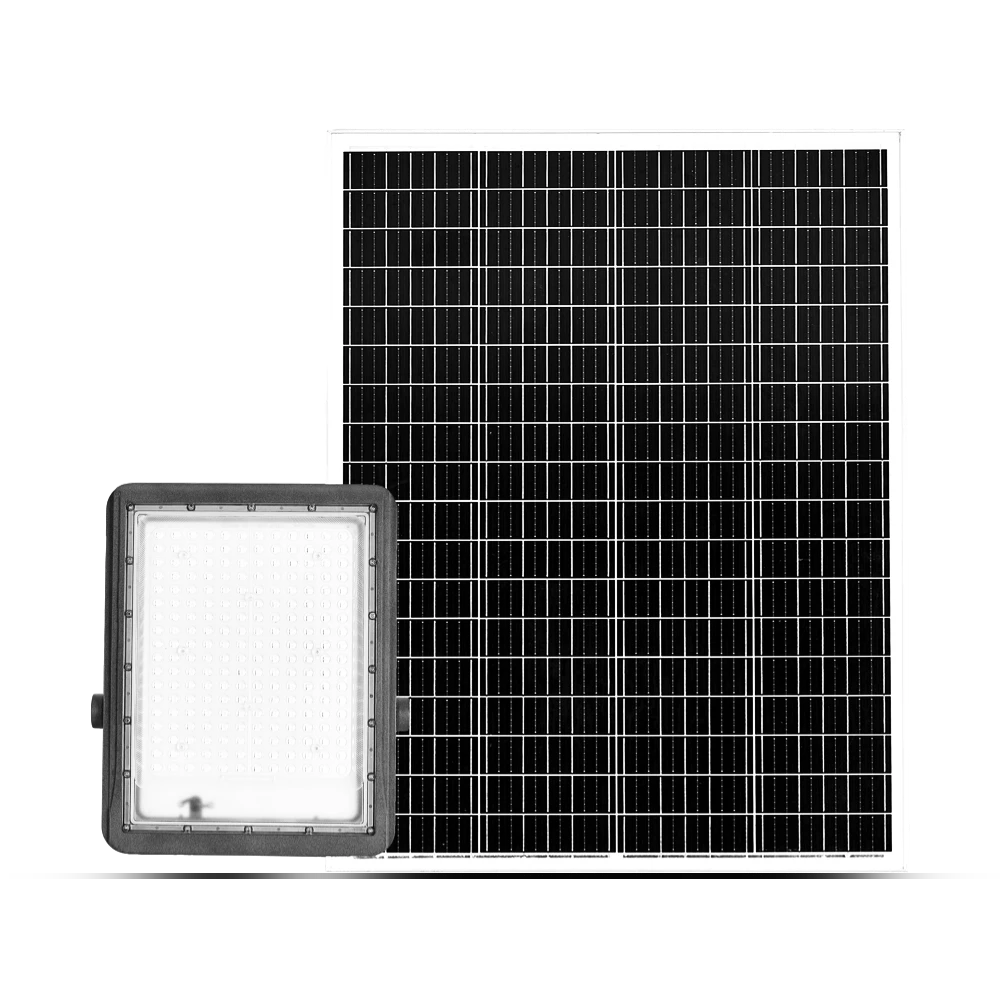
Queneng's Luxian Reliable Solar Street Light offers energy-saving LED lighting for outdoor use. This durable, solar-powered street light provides reliable illumination, reducing energy costs and environmental impact. A perfect solution for sustainable outdoor lighting.
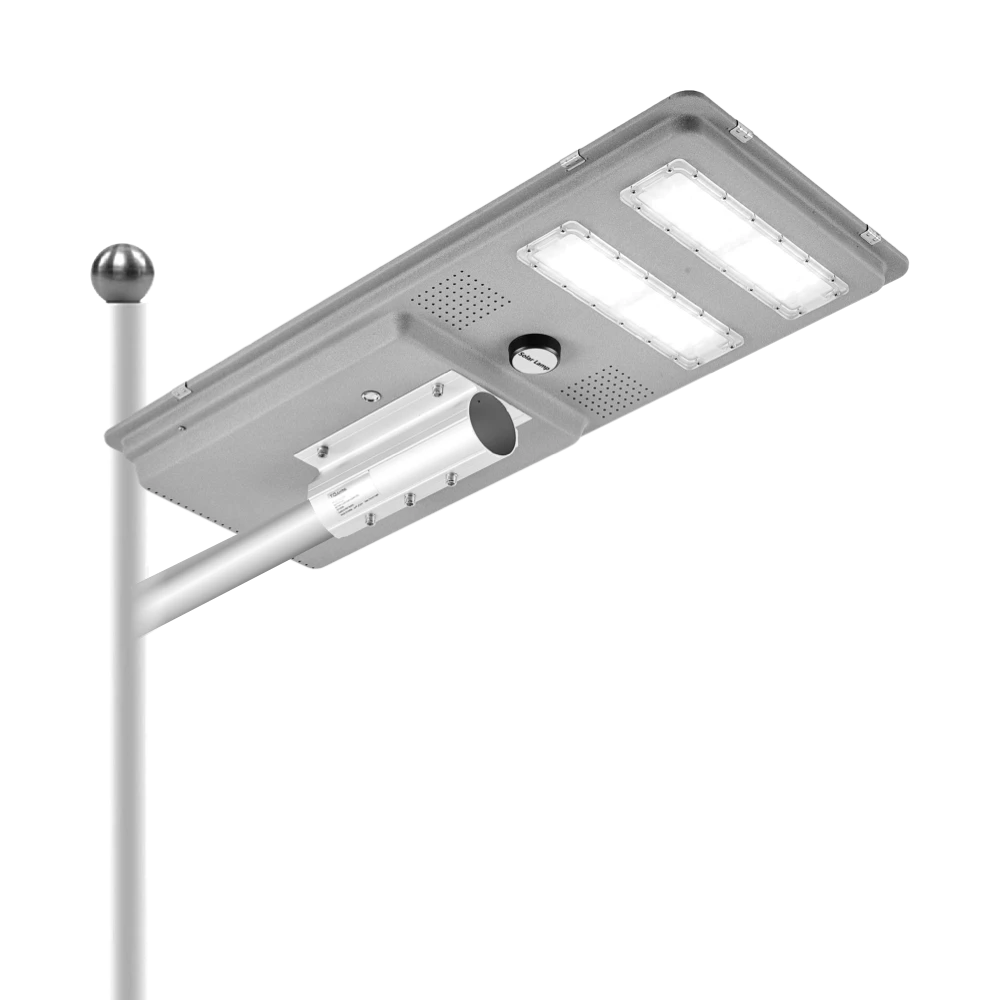
Queneng’s Solar Street Lights are designed to provide reliable, energy-efficient lighting for streets, parks, and other outdoor spaces.
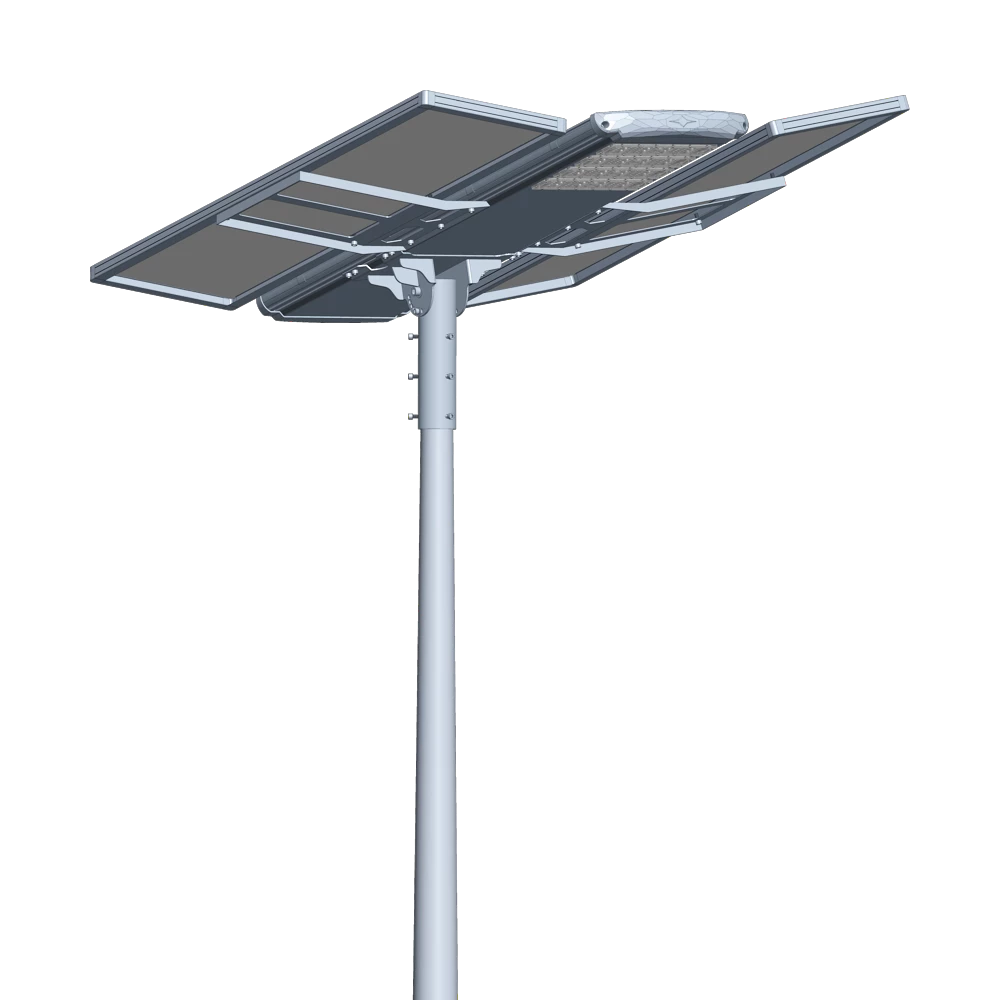
Introducing the Luqing Solar Street Light by Queneng, Efficient LED lighting powered by solar energy is perfect for illuminating outdoor areas. Harness the power of solar energy for sustainable, reliable street lighting. Ideal for eco-friendly, cost-effective outdoor illumination solutions.
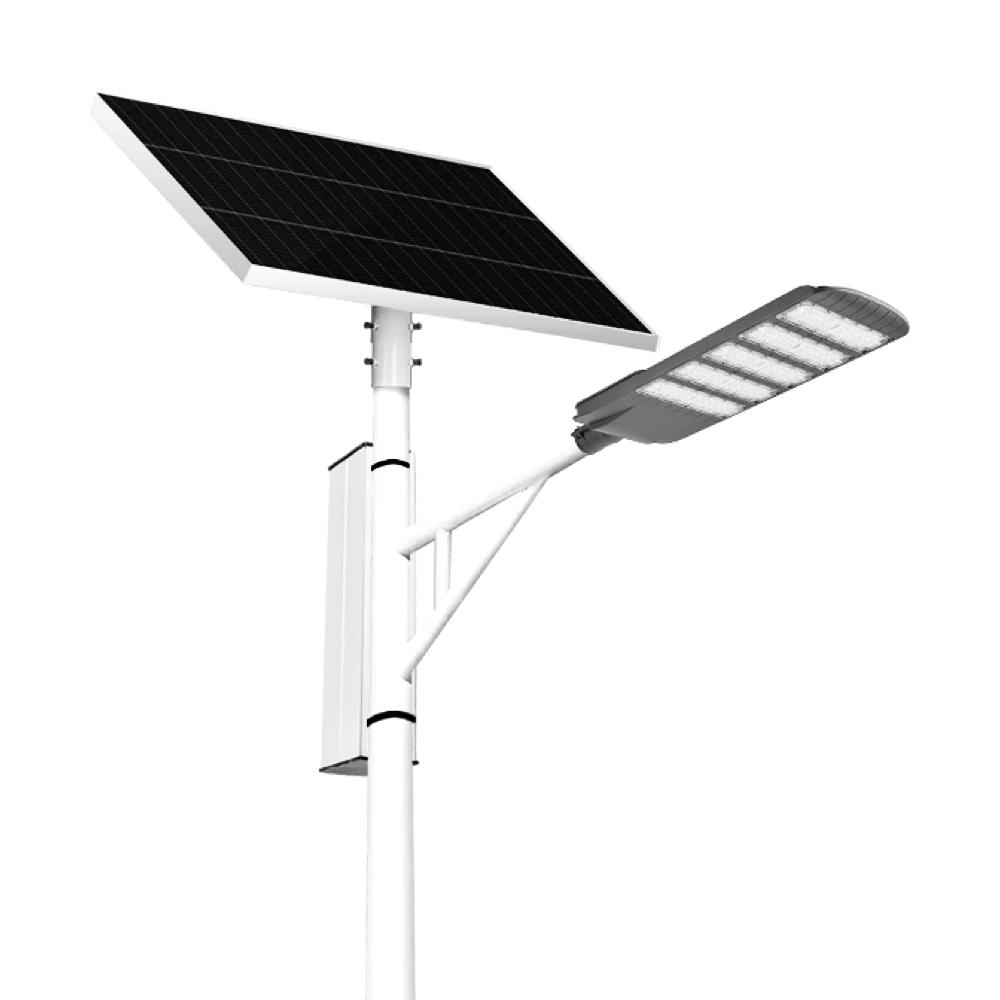
The Solar Streetlights of Luhao for Municipalities are designed to deliver reliable, energy-efficient, and cost-effective public lighting solutions. Equipped with advanced LED technology, durable lithium batteries, and high-efficiency solar panels, these streetlights provide consistent illumination for roads, parks, residential areas, and government projects.
Our professional team is ready to answer any questions and provide personalized support for your project.
You can reach us via phone or email to learn more about Queneng’s solar lighting solutions. We look forward to working with you to promote clean energy solutions!
Rest assured that your privacy is important to us, and all information provided will be handled with the utmost confidentiality.
By clicking 'Send Inquiry Now' I agree to Queneng processing my personal data.
To see how to withdraw your consent, how to control your personal data and how we process it, please see our Privacy Policy and Terms of use.
Schedule a Meeting
Book a date and time that is convenient for you and conduct the session in advance.
Have more questions about our products or services?
The messenger of light & power conversion
Environmental protection and intelligent manufacturing are our brand philosophy, and quality assurance and the best user experience are our eternal promises to users.
CONTACT
No.9F, Building F, Cao San Xin Tian Hong Logistics Park, Guzhen Town, Zhongshan City, Guangdong Province, China.
or write [email protected]
WhatsApp: +86 136 2270 1011


